Blog written by Larissa Roy and Jessica Hargreaves, with information from Donghao Li (PhD Researcher from MARUM, University of Bremen).
How do the tropics influence large-scale circulation patterns and interact with global climate variability?
Donghao’s doctoral research project studies the Tropical Atlantic-Pacific hydroclimate—the climate, variability, and teleconnections (which is basically how different oceans/areas connect)—during past periods, particularly the Last Interglacial and the Holocene. He uses insights from Earth-system modelling and connects this to coral reconstructions to bridge understanding. The project is called TAPIOLA, supervised by Ute Merkel at MARUM, University of Bremen.
At the heart of his project, he generates simulations using a version of the large ensemble model called the Community Earth System Model (iCESM v1.2.2), which incorporates water and carbon isotopes, for these past periods. The benefit of using a model that incorporates water and carbon isotopes is that when he has coral reconstructions from the same period, he can compare his model simulations with fossil corals and provide some interesting dynamical explanations for variability.
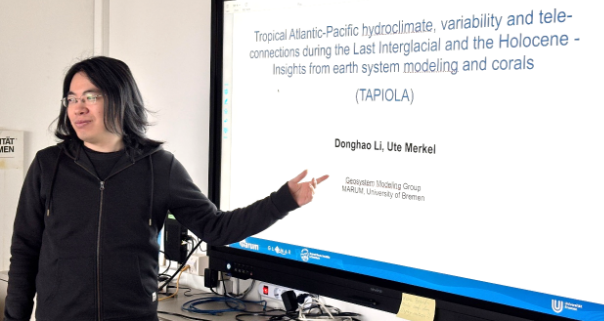
Figure 1: Picture of Donghao Li
What are the aims and focus of the project TAPIOLA?
This project aims to demonstrate the interplay between tropical climate dynamics, the mean state, the annual cycle, and the interannual variability in the tropical Atlantic and Pacific, as well as the teleconnections between the two ocean basins under warmer climate conditions, through earth-system modeling and coral analysis.
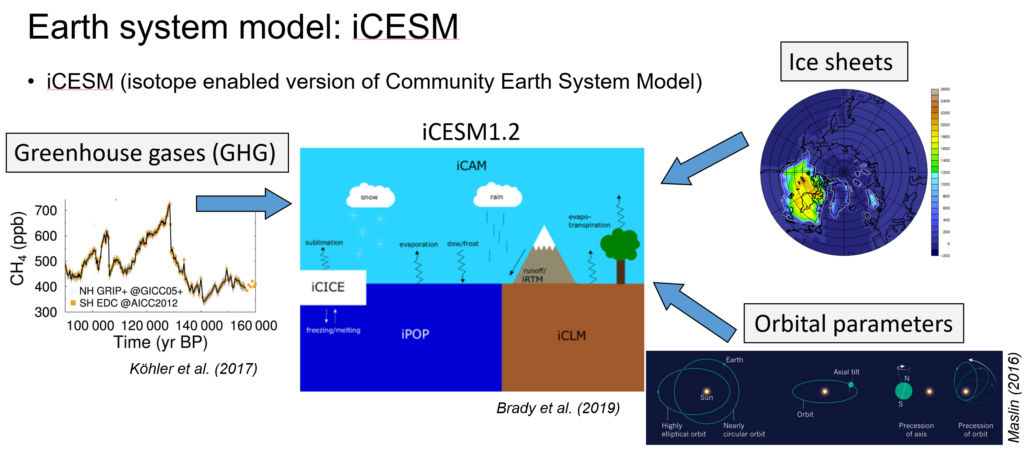
So what does the iCESM actually mean?
The iCESM is designed to simulate Earth’s climate by integrating multiple components. It consists of an atmosphere component (iCAM) for weather and air circulation, the ocean component (iPOP) for currents and heat transport, the sea ice component (iCICE) for ice dynamics, the land component (iCLM) for vegetation and soil processes, and a river runoff component (iRTM) that connects land and ocean water flows. These components exchange information through something called a coupler, which helps to ensure that there is a realistic climate system simulation.
To make the model more realistic, Donghao also selects certain boundary conditions, like the amount of greenhouse gases, ice sheets and land surface conditions, and orbital changes. As he can set these conditions, he can then simulate past periods by, for example for the Last Interglacial, making the greenhouse gas concentrations and ice sheet configurations match so that the realisation is more realistic, making it ideal for studying past, present, and future climate variability.
Why study the Last Interglacial and the Holocene?
These model simulations are a powerful tool for exploring climate dynamics across different time periods. But how do we establish a reference point for interpreting past warm climates like the Last Interglacial and the Holocene?
To answer this question, we need to look back to the time before industrialization. This helps us understand how things changed in the past and how they will change in the future. The figure shows the model output of the seasonal mean sea surface temperature across the Caribbean and tropical Atlantic during pre-industrial conditions. Sea surface temperature is a key factor in how weather varies in different regions, affecting connections between the Pacific and Atlantic Oceans and influencing patterns of rainfall and hurricane activity.
To do this, these simulations are compared with warmer periods like the Last Interglacial and the Holocene. This helps to better understand how the ocean and atmosphere respond to different climate conditions. Additional data from coral on Bonaire Island supports this analysis. This data provides real-world records of sea surface temperature. These records help evaluate the model’s accuracy and improve our understanding of past tropical climate dynamics.
How do we turn climate model data into something we can actually use?
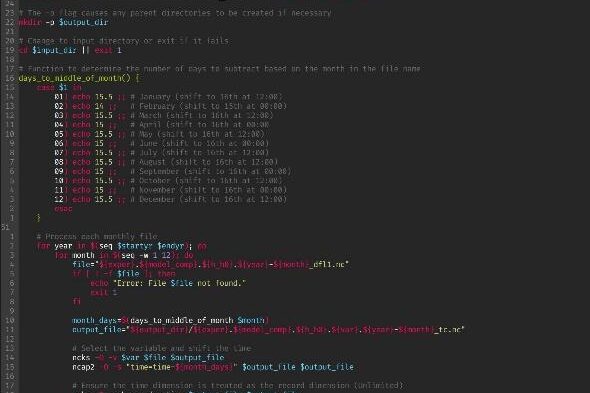
Climate models create a lot of raw data. To understand it, we need to process it first. The figure below shows a code example that does this. Before we can create maps or graphs of temperature or rainfall, we have to make the data smaller and focus on the right area. In this case, that area is the tropical Atlantic. This means choosing the right variables, changing the data format, and averaging it over time or space. This helps us compare it with real-world data, like records from coral.
To run the iCESM model, you also need code. Simulations are sent and managed on a supercomputer. This makes sure that the atmosphere, ocean, land, and sea ice parts of the model work together. By working with both the model and the data, we can better understand how climate patterns have changed between the pre-industrial period, the Last Interglacial, and the Holocene.
Looking to the Future
Using climate models and coral data can help us understand how the tropical ocean and atmosphere responded to past warm periods. By studying these natural warm intervals like the Last Interglacial and the Holocene, we gain valuable context for understanding our current warming climate. These past periods offer natural experiments that help us test our models and refine our predictions. The insights from TAPIOLA’s research don’t just tell us about the past, they provide crucial information about how tropical climate systems might behave as our planet continues to warm, helping us better anticipate future changes in rainfall patterns, ocean circulation, and extreme weather events.