Blog post written by Jessica Hargreaves.
Science paired with beer what could be better? Especially in Germany, the two go hand-in-hand.
If, like me, you are passionate about science and science communication you would probably love the Science Goes Public Initiative in Bremen and Bremerhaven. In the Autumn of 2023, I (Jessica Hargreaves) got the opportunity to present some of the work we are passionate about to the public in a Bremen pub. The initiative is very similar to a Pint of Science initiative which started in the UK and I got to give a talk titled ‘Reading the Coral Stories’.
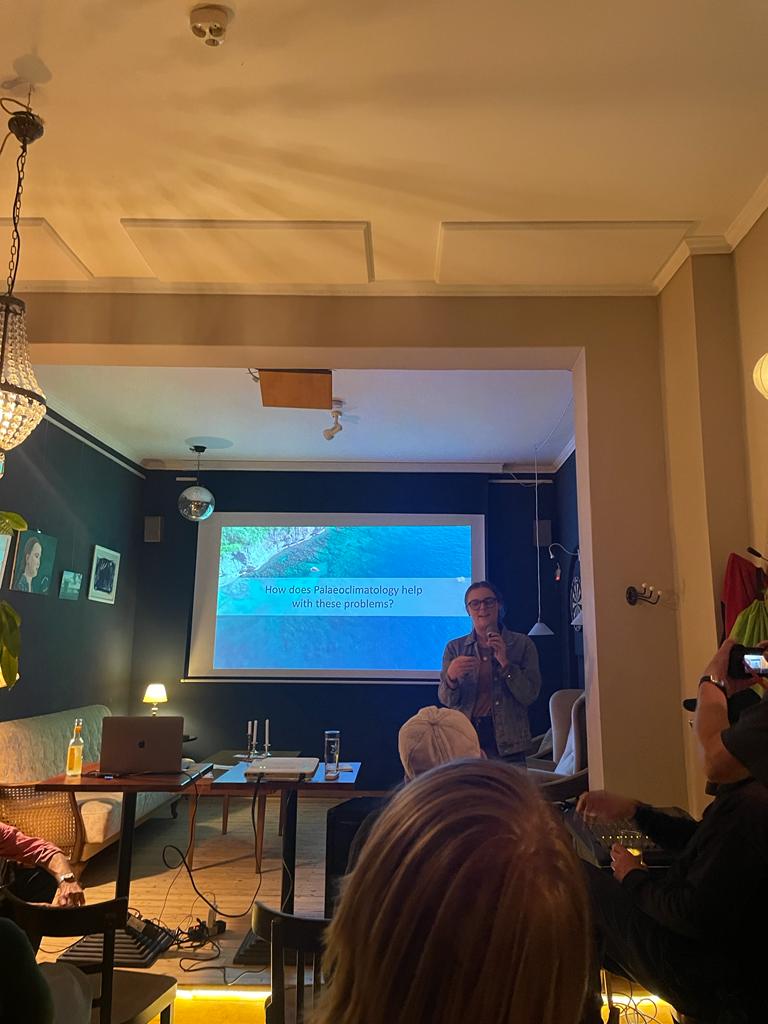
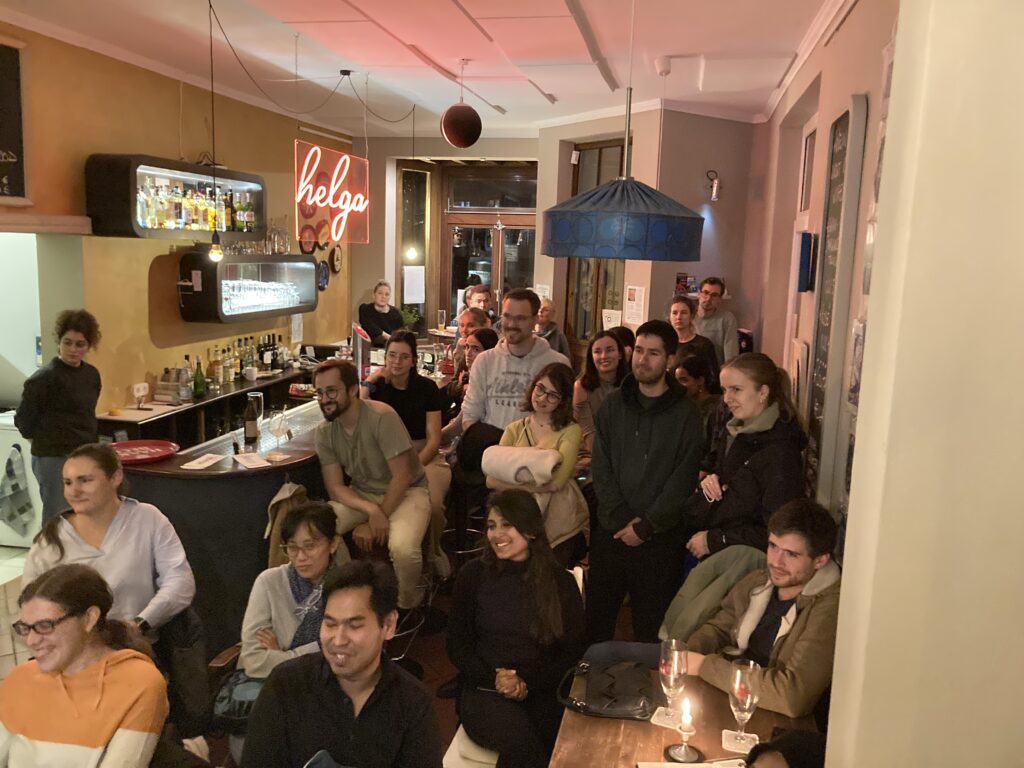
The session was a great experience. With a packed pub, we got started with some personal reflections on why I think everyone should care about the work we do here in the SPP 2299 programme and talked about my own experiences with large-scale climate changes (droning on about how cool Australia is), and then jumped into climate variability and how corals can tell us about climate. Effectively discussing how we read the coral stories.
On the night there were lots of amazing questions from the audience. People genuinely were interested in how we use corals to tell us about sea surface temperatures and rainfall. Others wanted to know about some good diving and snorkelling spots in the Indian and Pacific Oceans, and others are interested in how I deal with all the devastating climate news we deal with every day. That question in itself could be a whole blog on its own, but not for today.
So a bit about me and what we talked about on the night!
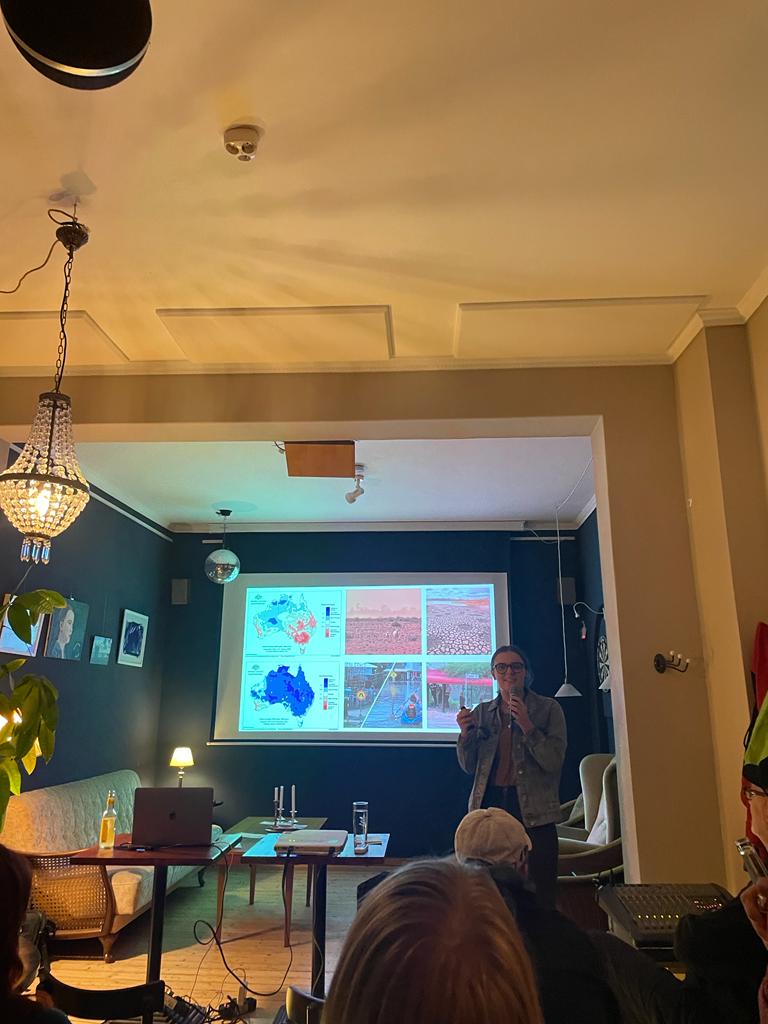
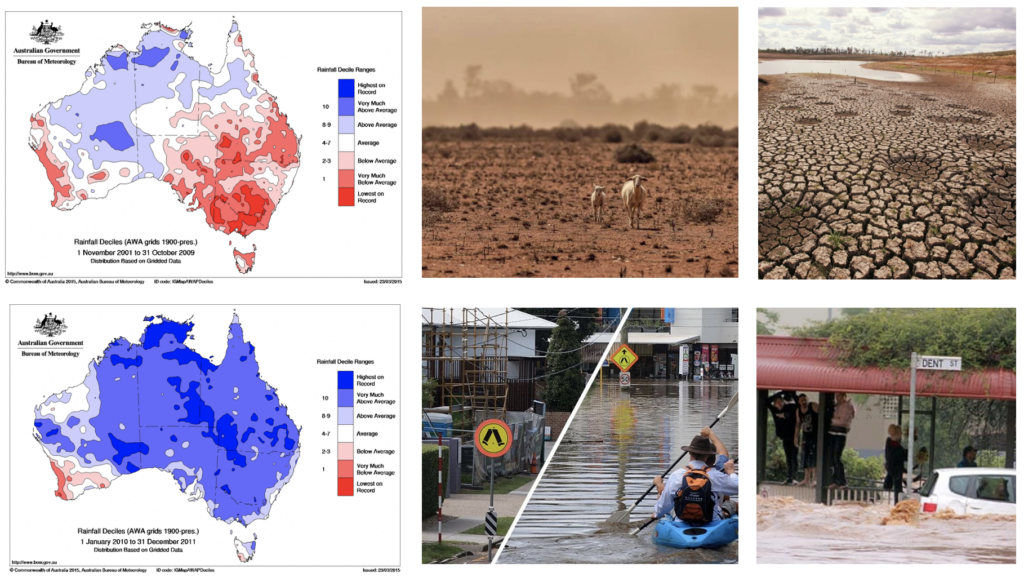
I am originally from the east coast of Australia, and large-scale climate variability impacts our region particularly harshly. During my childhood, Australia was going through one of our biggest droughts called the Millennium Drought. It lasted from when I was 1 until the age of 14, and some of my strongest memories of that period include major water restrictions where we had to use 2-minute shower timers and were never allowed to water our gardens or fill our pools (unless you lived in a bushfire zone).
My strongest memory of this whole time however occurred during the year I turned 15 and Australia began experiencing massive floods across the entire east coast. We went from barren lands and worrying about where our drinking water was coming from, to houses floating down the streets. This type of switch is not unusual in Australia, we are the land of varying climates – just as the poem ‘My Country’ describes. The unusual thing here was the length of time the drought lasted, the influence that a background warming climate had on the extreme variability and also the magnitude of the extremes.
“I love a sunburnt country, A land of sweeping plains, Of ragged mountain ranges, Of droughts and flooding rains. I love her far horizons, I love her jewel-sea, Her beauty and her terror The wide brown land for me! “
2nd stanza of the poem ‘My Country’ by Dorothea Mackellar
One of the reasons Australia is so variable is a large-scale mode of variability called the El Niño Southern Oscillation (ENSO), which is a coupled ocean-atmosphere mode of variability that influences sea surface temperatures across the Pacific Ocean and directly impacts rainfall across the Australian region. This mode of variability doesn’t only impact the region directly next to the Pacific Ocean. During the warm phase of ENSO, called El Niño global temperatures are particularly affected which means that locations much further than Australia feel the heat. During an El Niño phase (which climate models suggest has just peaked) global temperatures typically increase by up to 0.07°C for every degree of warming in the Nino3.4 region of the Pacific Ocean (which is a region that a metric of measure changes in ENSO – see the image further down!).
Now a change of 0.07°C may not sound like a lot, but during a large El Niño event the global shift in temperatures can involve huge transfers of heat between the ocean and atmosphere. These large shifts in temperature, on top of an already changing climate are some of the more concerning aspects of this discussion. The extremes associated with El Niño can be (and were) catastrophic. It was found that the influence of background climate changes as well as the interaction of several other large climate oscillations, led to extreme conditions during this Millennium drought period.
During this period, while we didn’t have many consecutive or large El Niño events (apart from the 1997/1998 event), the effect of the smaller events was stronger because of the already warming atmosphere. Also, a lack of big La Niña events during the early 2000s, meant no drought-breaking rains were heading Australia’s way until the ‘double dipped La Niña’ began at the end of the drought. These events are however not straightforward, with different flavours of ENSO, and other processes in the Indian and Southern Ocean also influencing the Australian climate.
(top) Monthly average global surface temperature compared to the 20th-century average. (bottom) Monthly sea surface temperature in the Niño3.4 region of the tropical Pacific—the key ENSO-monitoring region—compared to the 20th-century average, with El Niño periods coloured red and La Niña periods coloured blue. The peaks and valleys of each line tend to line up, showing how global temperature tends to rise with El Niño and fall with La Niña following a short lag. NOAA Climate.gov image, adapted from original by Mike McPhaden
So what do the phases of ENSO mean for the rest of the globe?
The interaction between global temperature increases and natural climate variability like ENSO also influences other areas across the globe. Areas like the United States are directly impacted by the proximity to the Pacific Ocean, but regions like Europe are also influenced due to global temperature changes during ENSO events and teleconnections. Changes during ENSO events also influence extremes such as cyclonic (or Hurricane) activity among many other changes.
While global temperature records continue to be broken – last year was the warmest on record with global temperature last year reaching 1.48°C above pre-industrial levels (1850-1900) and with a bit more than a month into 2024, this trend continues and temperatures are looking particularly high once again over January., likely influenced by the peaking El Niño event – the temperature influence of ENSO events is not the only impact we need to understand.
The influence of changes in the climate at this scale is felt so far and wide through teleconnections, that we need to understand these patterns and interactions on a longer time scale so we can figure out how these patterns might operate in the future, and understand more in-depth how they interact together! This is where my research and the SPP 2299 programme comes in.
If we can understand how global climate variability has varied through the past in a higher resolution, as some projects within our programme are looking into, maybe we can help inform mitigation and adaptation strategies in the face of climate change worldwide.